监控仪表盘
功能介绍
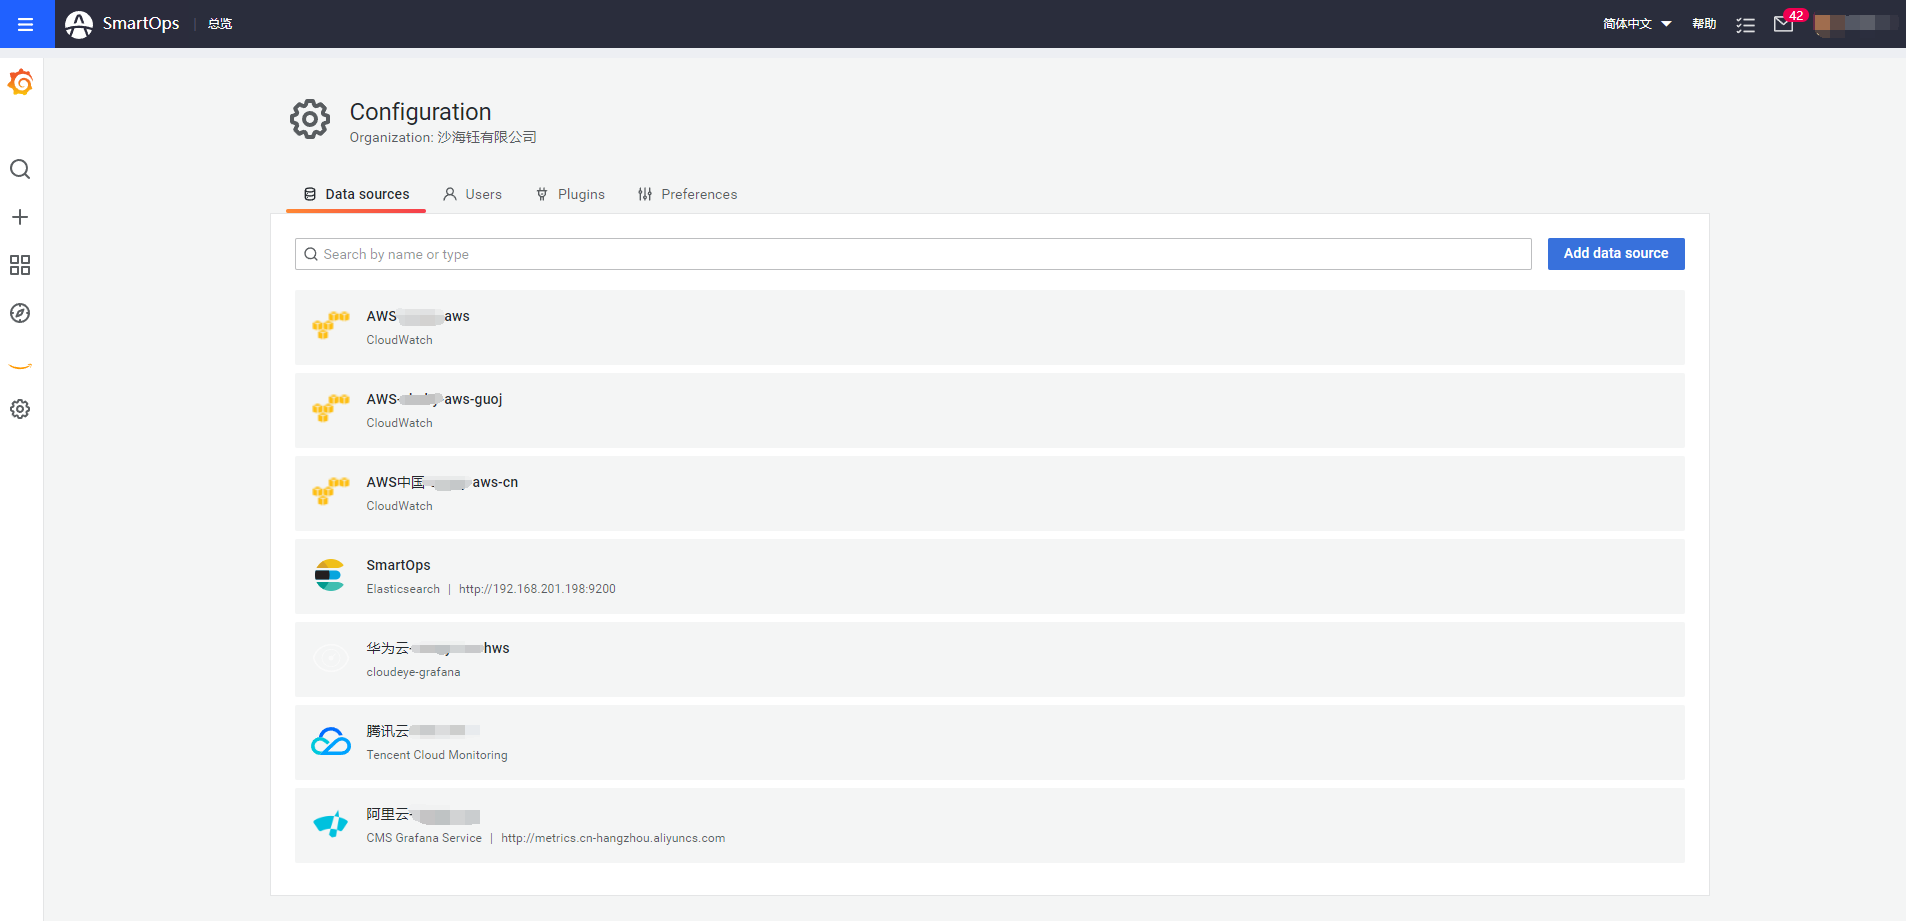
SmartOps云管平台集成Grafana,用户体系打通,根据SmartOps平台账户下云账户信息,通过腾讯云、阿里云、华为云、亚马逊、Azure五家公有云厂商Grafana Plugins 默认配置其对应数据源。
支持在Grafana中展示SmartOps平台监控数据(SmartOps Agent 插件采集数据),已经配置好名称为“SmartOps”的数据源(Elastic search类型)。
操作指南
1、查看监控仪表盘
(1)登录云管平台 -> 点击左侧菜单。
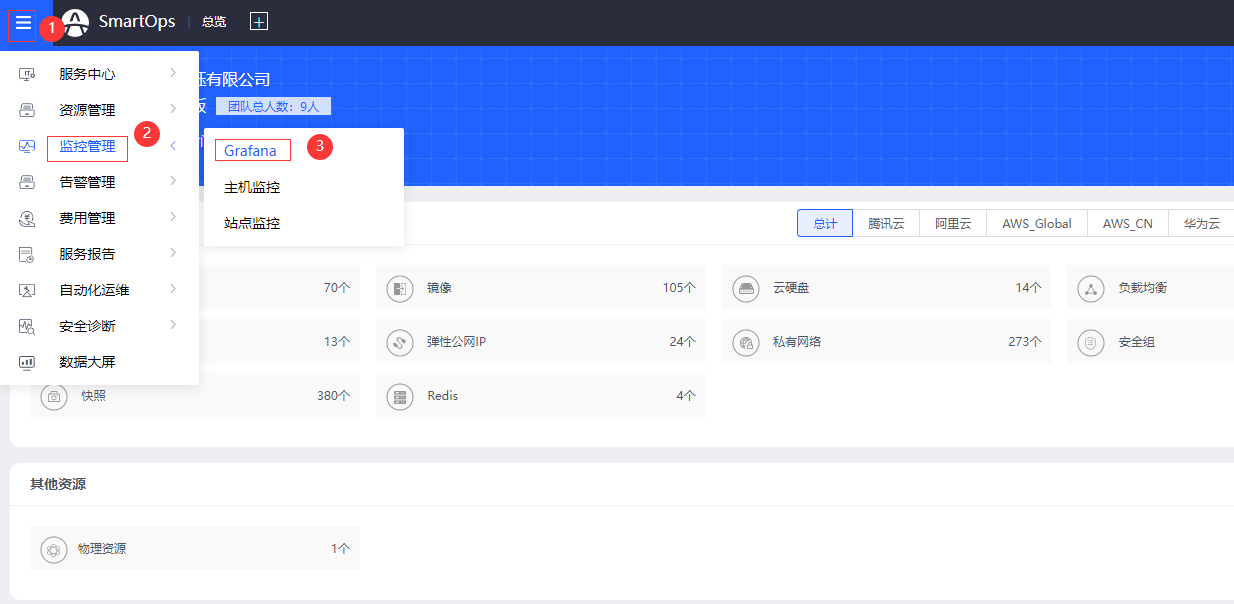
(2) 进入监控仪表盘页面。
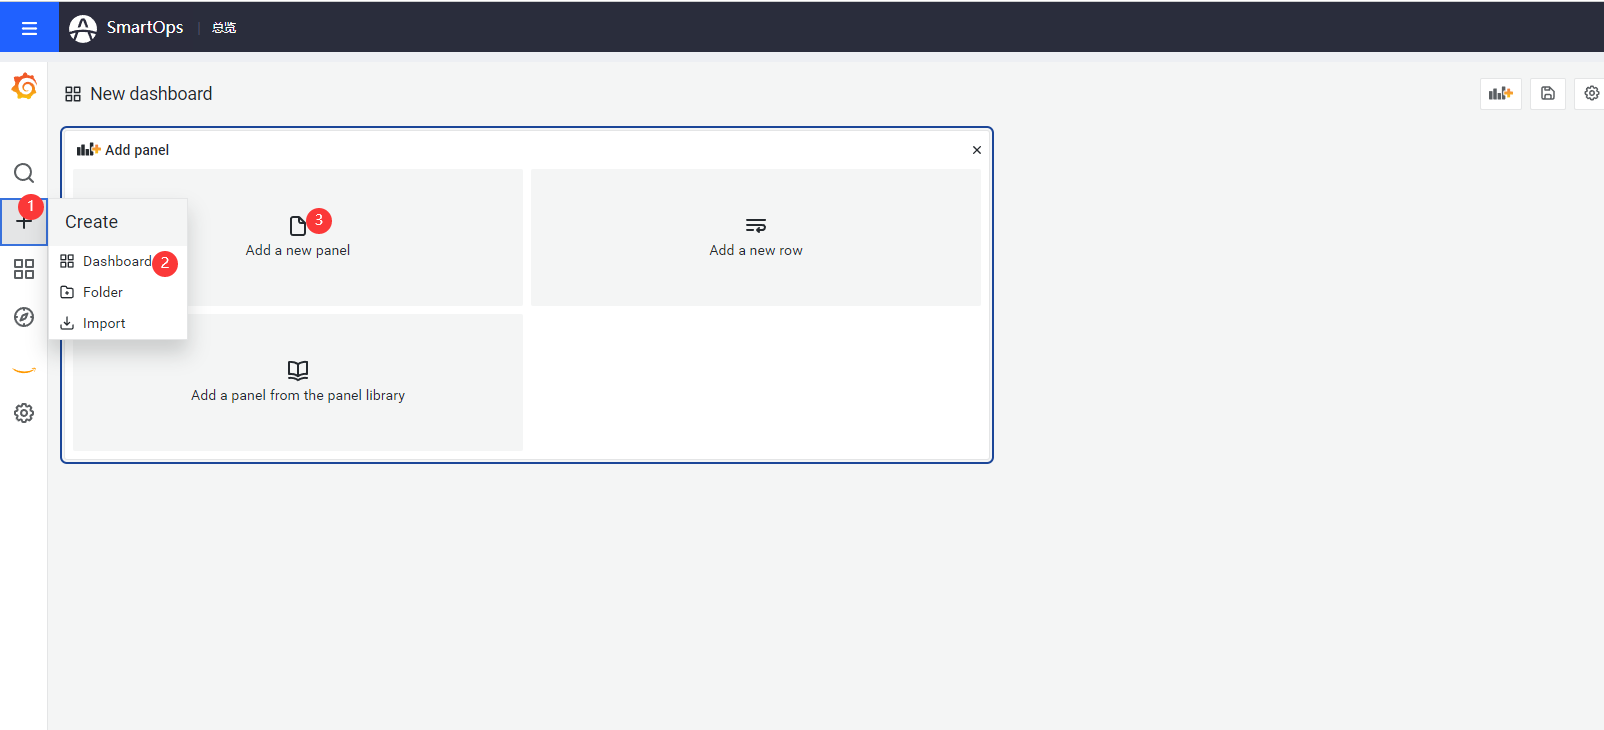
2、SmartOps数据源配置Dashboard
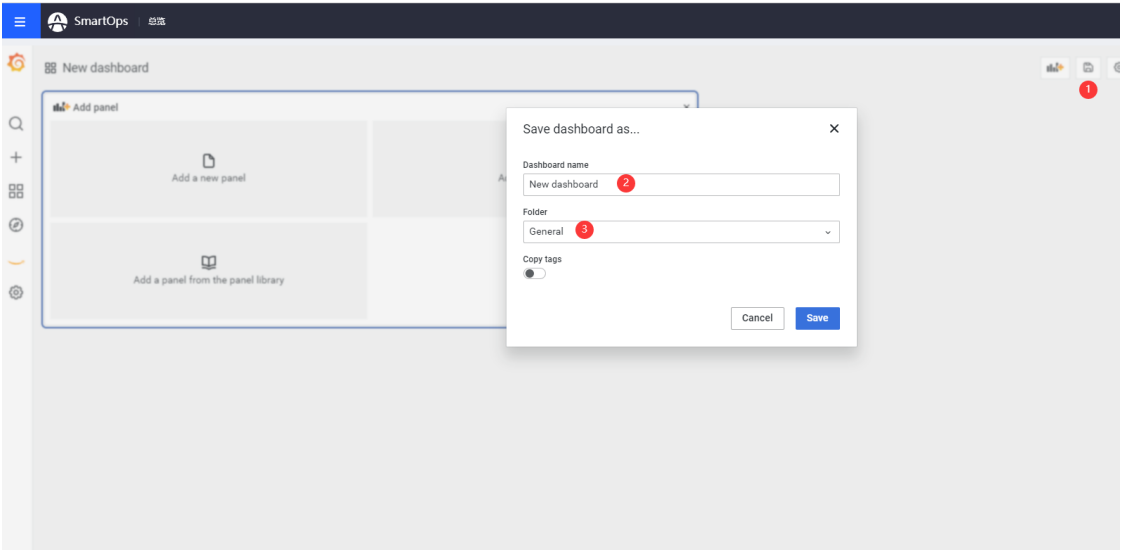
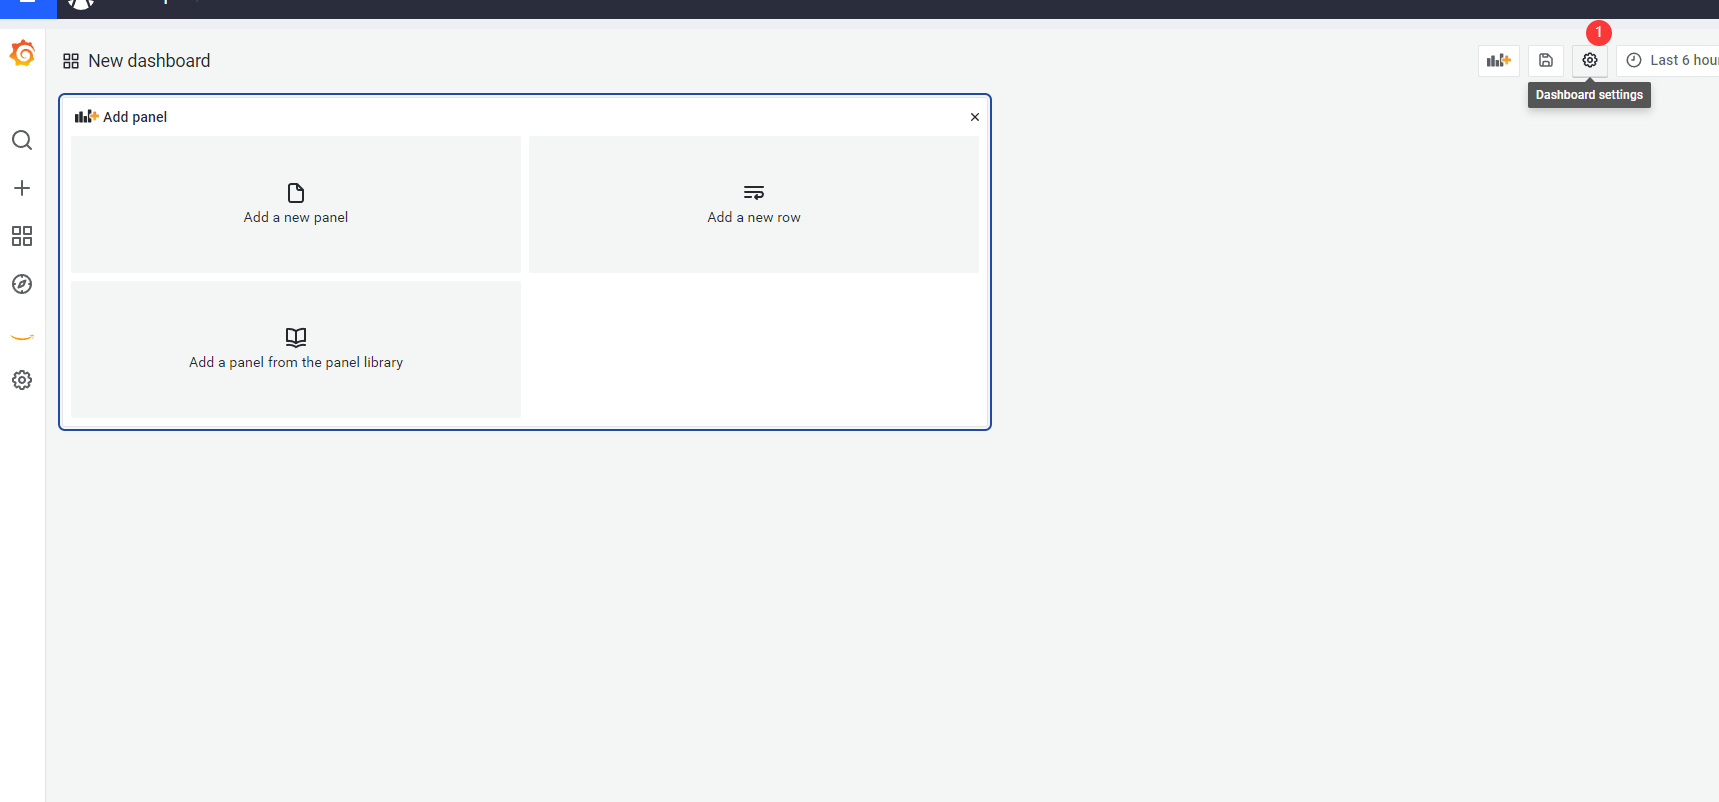
(1) 新增Dashboard,设置Dashboard 名称和所属文件夹。
(2) 点击Dashboard设置按钮,新增变量。
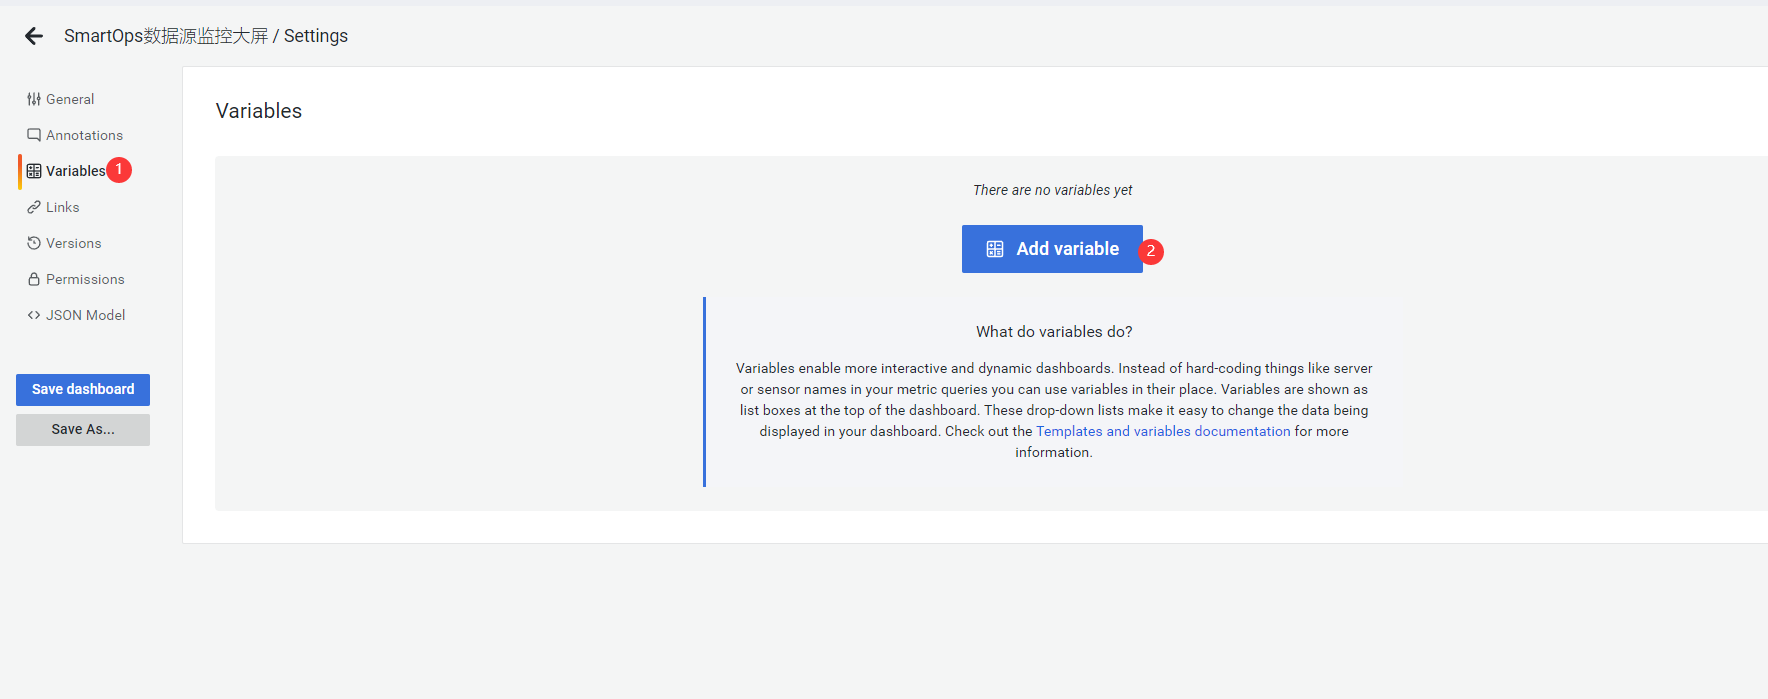
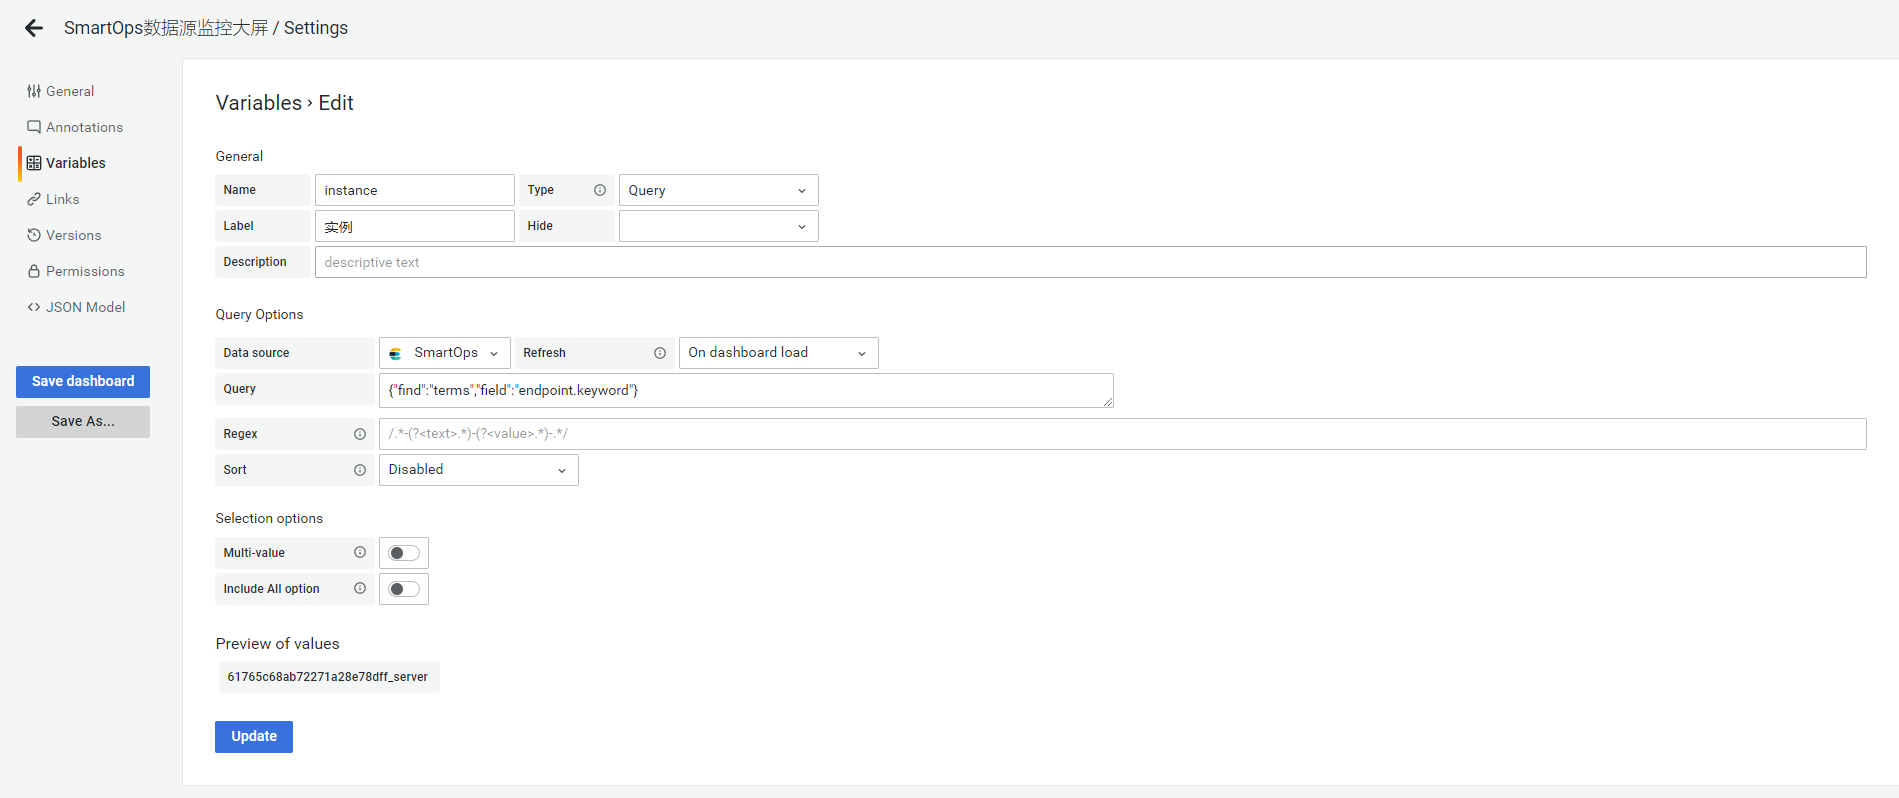
3、配置实例变量
Name::变量名称
Type:选择Query从数据源中获取
Label:标签(类似别名)
Dara source:选择‘SmartOps’数据源
Refresh:加载时间 选择‘On dashboard load’
Query:{"find":"terms","field":"endpoint.keyword"} 表示查询全部‘endpoint’列表
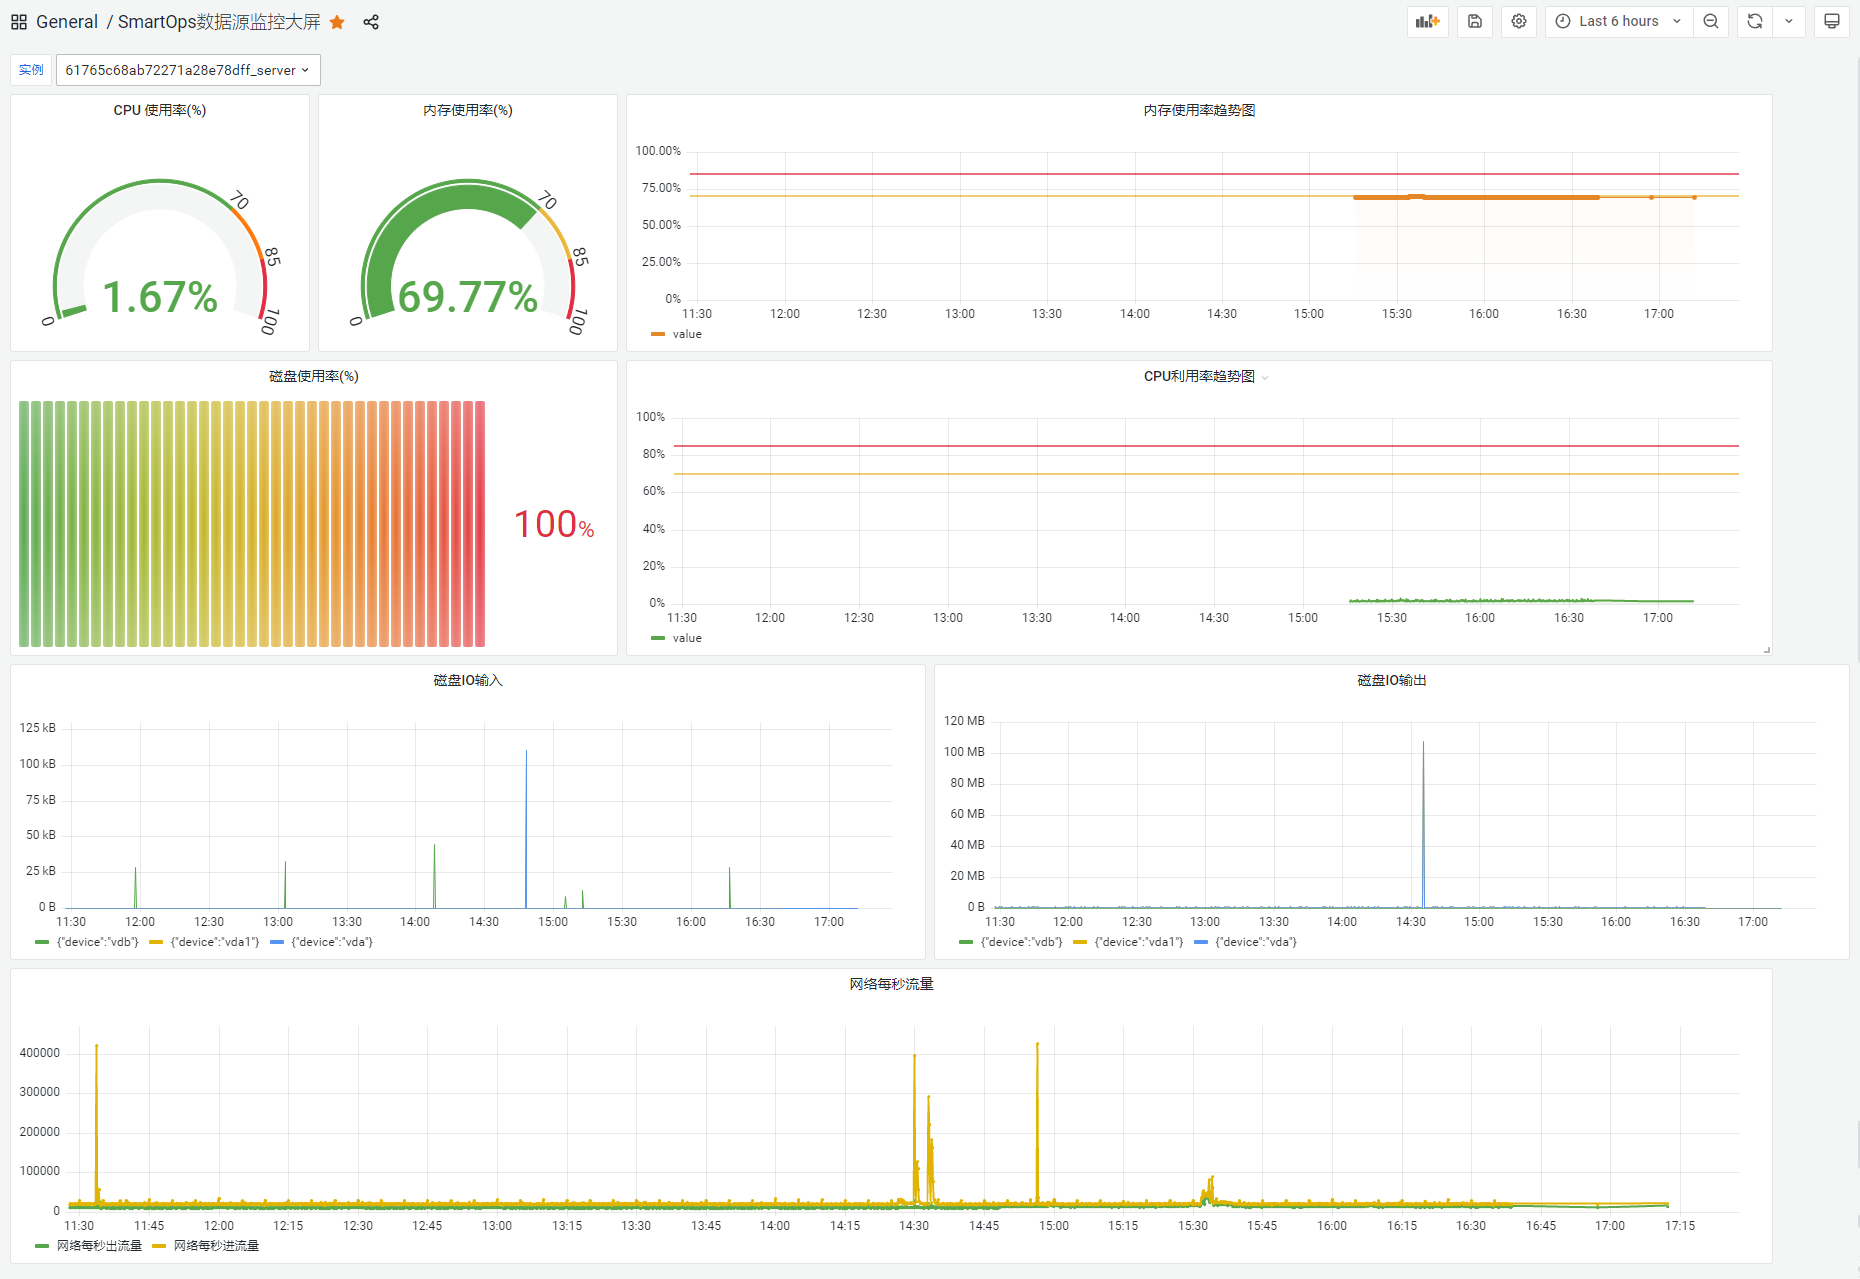
4、自定义Panel
预览Dashboard,具体可参考文档末尾中的Json信息或者Json文件
附
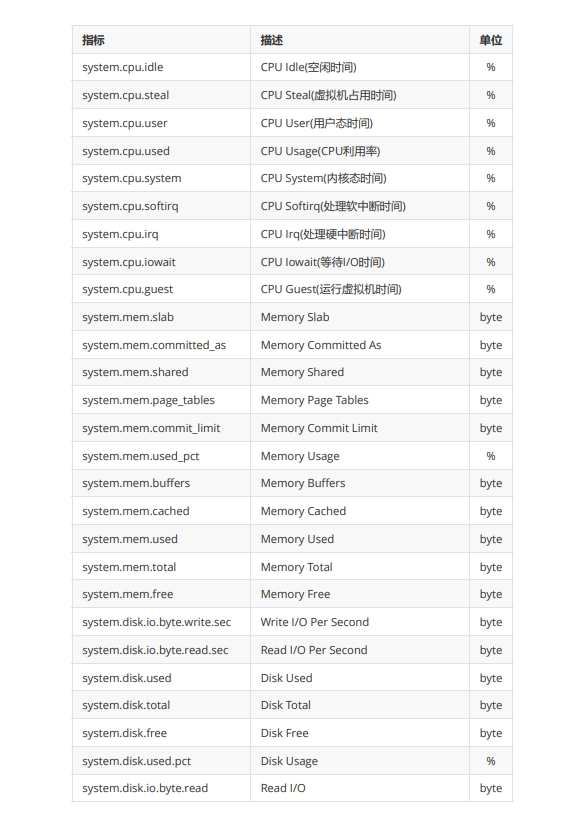
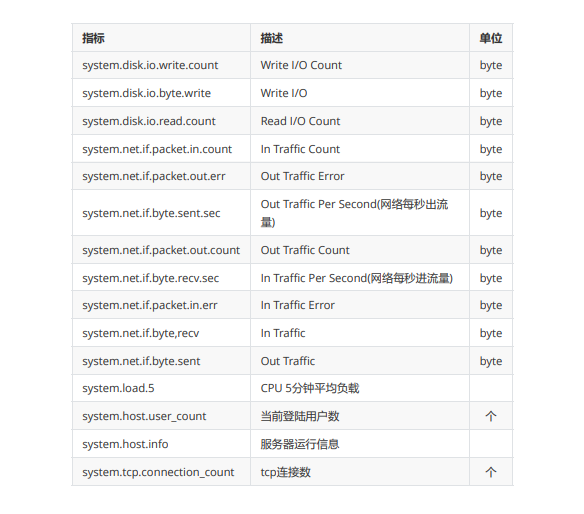
metric指标
{ "annotations": { "list": [ { "builtIn": 1, "datasource": "-- Grafana --", "enable": true, "hide": true, "iconColor": "rgba(0, 211, 255, 1)", "name": "Annotations & Alerts", "target": { "limit": 100, "matchAny": false, "tags": [], "type": "dashboard"
   },
    "type": "dashboard"

 }
] }, "editable": true, "fiscalYearStartMonth": 0, "graphTooltip": 0, "id": 265, "iteration": 1663234046333, "links": [], "liveNow": false, "panels": [ { "datasource": { "type": "elasticsearch", "uid": "Nmnw4m7Vz"
 },
  "fieldConfig": {
    "defaults": {
      "decimals": 2,
      "mappings": [],
      "max": 100,
      "min": 0,
      "thresholds": {
        "mode": "percentage",
        "steps": [
         {
            "color": "green",
            "value": null

         },
         {
            "color": "orange",
            "value": 70

         },
         {
            "color": "red",
            "value": 85

         }
       ]
     },
      "unit": "percent"

   },
    "overrides": []
 },
  "gridPos": {
    "h": 7,
    "w": 4,
    "x": 0,

    "y": 0

 },
  "id": 2,
  "options": {
    "orientation": "auto",
    "reduceOptions": {
      "calcs": [
        "lastNotNull"

     ],
      "fields": "",
      "values": false

   },
    "showThresholdLabels": true,
    "showThresholdMarkers": true

 },
  "pluginVersion": "8.4.6",
  "targets": [
   {
      "alias": "",
      "bucketAggs": [
       {
          "field": "time",
          "id": "2",
          "settings": {
            "min_doc_count": "1",
            "order": "desc",
            "orderBy": "_term",
            "size": "10"

         },
          "type": "terms"

       }
     ],
      "datasource": {
        "type": "elasticsearch",
        "uid": "Nmnw4m7Vz"

     },
      "metrics": [
       {
          "field": "value",
          "id": "1",
          "type": "avg"

       }
     ],
      "query": "endpoint:$instance AND
metric:\"system.cpu.used\"", "refId": "A", "timeField": "time"
   }
 ],


  "title": "CPU 使用率(%)",
  "type": "gauge"
}, { "datasource": { "type": "elasticsearch", "uid": "Nmnw4m7Vz"
 },
  "fieldConfig": {
    "defaults": {
      "color": {
        "mode": "thresholds"

     },
      "decimals": 2,
      "mappings": [],
      "max": 100,
      "min": 0,
      "thresholds": {
        "mode": "percentage",
        "steps": [
         {
            "color": "green",
            "value": null

         },
         {
            "color": "#EAB839",
            "value": 70

         },
         {
            "color": "red",
            "value": 85

         }
       ]
     },
      "unit": "percent"

   },
    "overrides": []
 },
  "gridPos": {
    "h": 7,
    "w": 4,
    "x": 4,
    "y": 0

 },
  "id": 4,
  "options": {
    "orientation": "auto",
    "reduceOptions": {
      "calcs": [


        "lastNotNull"

     ],
      "fields": "",
      "values": false

   },
    "showThresholdLabels": true,
    "showThresholdMarkers": true

 },
  "pluginVersion": "8.4.6",
  "targets": [
   {
      "alias": "",
      "bucketAggs": [
       {
          "field": "time",
          "id": "2",
          "settings": {
            "interval": "auto"

         },
          "type": "date_histogram"

       }
     ],
      "datasource": {
        "type": "elasticsearch",
        "uid": "Nmnw4m7Vz"

     },
      "metrics": [
       {
          "field": "value",
          "id": "1",
          "type": "avg"

       }
     ],
      "query": "endpoint:$instance AND
metric:\"system.mem.used_pct\"", "refId": "A", "timeField": "time"
   }
 ],
  "title": "内存使用率(%)",
  "type": "gauge"
}, { "datasource": { "type": "elasticsearch", "uid": "Nmnw4m7Vz"
 },
  "fieldConfig": {
    "defaults": {


      "color": {
        "mode": "continuous-GrYlRd",
        "seriesBy": "last"

     },
      "custom": {
        "axisLabel": "",
        "axisPlacement": "auto",
        "barAlignment": 0,
        "drawStyle": "line",
        "fillOpacity": 5,
        "gradientMode": "opacity",
        "hideFrom": {
          "legend": false,
          "tooltip": false,
          "viz": false

       },
        "lineInterpolation": "linear",
        "lineStyle": {
          "fill": "solid"

       },
        "lineWidth": 1,
        "pointSize": 5,
        "scaleDistribution": {
          "type": "linear"

       },
        "showPoints": "always",
        "spanNulls": true,
        "stacking": {
          "group": "A",
          "mode": "normal"

       },
        "thresholdsStyle": {
          "mode": "line"

       }
     },
      "decimals": 2,
      "mappings": [],
      "max": 100,
      "min": 0,
      "thresholds": {
        "mode": "percentage",
        "steps": [
         {
            "color": "green",
            "value": null

         },
         {
            "color": "#EAB839",
            "value": 70


         },
         {
            "color": "red",
            "value": 85

         }
       ]
     },
      "unit": "percent"

   },
    "overrides": []
 },
  "gridPos": {
    "h": 7,
    "w": 15,
    "x": 8,
    "y": 0

 },
  "id": 10,
  "options": {
    "legend": {
      "calcs": [],
      "displayMode": "list",
      "placement": "bottom"

   },
    "tooltip": {
      "mode": "single",
      "sort": "asc"

   }
 },
  "targets": [
   {
      "alias": "",
      "bucketAggs": [],
      "datasource": {
        "type": "elasticsearch",
        "uid": "Nmnw4m7Vz"

     },
      "metrics": [
       {
          "id": "1",
          "settings": {
            "size": "500"

         },
          "type": "raw_data"

       }
     ],
      "query": "endpoint:$instance AND
metric:\"system.mem.used_pct\"", "refId": "A",
      "timeField": "time"

   }
 ],
  "title": "内存使用率趋势图",
  "type": "timeseries"
}, { "datasource": { "type": "elasticsearch", "uid": "Nmnw4m7Vz"
 },
  "fieldConfig": {
    "defaults": {
      "color": {
        "mode": "continuous-GrYlRd"

     },
      "decimals": 2,
      "mappings": [],
      "max": 100,
      "min": 0,
      "thresholds": {
        "mode": "percentage",
        "steps": [
         {
            "color": "green",
            "value": null

         },
         {
            "color": "red",
            "value": 80

         }
       ]
     },
      "unit": "percent"

   },
    "overrides": []
 },
  "gridPos": {
    "h": 8,
    "w": 8,
    "x": 0,
    "y": 7

 },
  "id": 6,
  "options": {
    "displayMode": "lcd",
    "orientation": "horizontal",
    "reduceOptions": {
      "calcs": [],


      "fields": "",
      "values": true

   },
    "showUnfilled": true

 },
  "pluginVersion": "8.4.6",
  "targets": [
   {
      "alias": "",
      "bucketAggs": [
       {
          "field": "tag.keyword",
          "id": "2",
          "settings": {
            "min_doc_count": "1",
            "order": "desc",
            "orderBy": "_term",
            "size": "10"

         },
          "type": "terms"

       }
     ],
      "datasource": {
        "type": "elasticsearch",
        "uid": "Nmnw4m7Vz"

     },
      "metrics": [
       {
          "field": "value",
          "id": "1",
          "type": "avg"

       }
     ],
      "query": "endpoint:$instance AND
metric:\"system.disk.used.pct\"", "refId": "A", "timeField": "time"
   }
 ],
  "title": "磁盘使用率(%)",
  "type": "bargauge"
}, { "datasource": { "type": "elasticsearch", "uid": "Nmnw4m7Vz"
 },
  "description": "",
  "fieldConfig": {


    "defaults": {
      "color": {
        "mode": "continuous-GrYlRd"

     },
      "custom": {
        "axisLabel": "",
        "axisPlacement": "auto",
        "barAlignment": 0,
        "drawStyle": "line",
        "fillOpacity": 10,
        "gradientMode": "scheme",
        "hideFrom": {
          "legend": false,
          "tooltip": false,
          "viz": false

       },
        "lineInterpolation": "smooth",
        "lineWidth": 2,
        "pointSize": 3,
        "scaleDistribution": {
          "type": "linear"

       },
        "showPoints": "auto",
        "spanNulls": false,
        "stacking": {
          "group": "A",
          "mode": "none"

       },
        "thresholdsStyle": {
          "mode": "line"

       }
     },
      "mappings": [],
      "max": 100,
      "min": 0,
      "thresholds": {
        "mode": "absolute",
        "steps": [
         {
            "color": "green",
            "value": null

         },
         {
            "color": "#EAB839",
            "value": 70

         },
         {
            "color": "red",
            "value": 85

         }
       ]
     },
      "unit": "percent"

   },
    "overrides": []
 },
  "gridPos": {
    "h": 8,
    "w": 15,
    "x": 8,
    "y": 7

 },
  "id": 8,
  "options": {
    "legend": {
      "calcs": [],
      "displayMode": "list",
      "placement": "bottom"

   },
    "tooltip": {
      "mode": "single",
      "sort": "none"

   }
 },
  "targets": [
   {
      "alias": "",
      "bucketAggs": [],
      "datasource": {
        "type": "elasticsearch",
        "uid": "Nmnw4m7Vz"

     },
      "metrics": [
       {
          "id": "1",
          "settings": {
            "size": "500"

         },
          "type": "raw_data"

       }
     ],
      "query": "endpoint:$instance AND
metric:\"system.cpu.used\"", "refId": "A", "timeField": "time"
   }
 ],
  "title": "CPU利用率趋势图",


  "type": "timeseries"
}, { "datasource": { "type": "elasticsearch", "uid": "Nmnw4m7Vz"
 },
  "fieldConfig": {
    "defaults": {
      "color": {
        "mode": "palette-classic"

     },
      "custom": {
        "axisLabel": "",
        "axisPlacement": "auto",
        "barAlignment": 0,
        "drawStyle": "line",
        "fillOpacity": 0,
        "gradientMode": "none",
        "hideFrom": {
          "legend": false,
          "tooltip": false,
          "viz": false

       },
        "lineInterpolation": "linear",
        "lineWidth": 1,
        "pointSize": 5,
        "scaleDistribution": {
          "type": "linear"

       },
        "showPoints": "auto",
        "spanNulls": true,
        "stacking": {
          "group": "A",
          "mode": "none"

       },
        "thresholdsStyle": {
          "mode": "off"

       }
     },
      "mappings": [],
      "thresholds": {
        "mode": "absolute",
        "steps": [
         {
            "color": "green",
            "value": null

         }
       ]

     },
      "unit": "decbytes"

   },
    "overrides": []
 },
  "gridPos": {
    "h": 8,
    "w": 11,
    "x": 0,
    "y": 15

 },
  "id": 12,
  "options": {
    "legend": {
      "calcs": [],
      "displayMode": "list",
      "placement": "bottom"

   },
    "tooltip": {
      "mode": "multi",
      "sort": "asc"

   }
 },
  "targets": [
   {
      "alias": "",
      "bucketAggs": [
       {
          "field": "tag.keyword",
          "id": "3",
          "settings": {
            "min_doc_count": "1",
            "order": "desc",
            "orderBy": "_term",
            "size": "10"

         },
          "type": "terms"

       },
       {
          "field": "time",
          "id": "2",
          "settings": {
            "interval": "auto"

         },
          "type": "date_histogram"

       }
     ],
      "datasource": {
        "type": "elasticsearch",

        "uid": "Nmnw4m7Vz"

     },
      "metrics": [
       {
          "field": "value",
          "id": "1",
          "type": "max"

       }
     ],
      "query": "endpoint:$instance AND
metric:\"system.disk.io.byte.read\"", "refId": "A", "timeField": "time"
   }
 ],
  "title": "磁盘IO输入",
  "type": "timeseries"
}, { "datasource": { "type": "elasticsearch", "uid": "Nmnw4m7Vz"
 },
  "fieldConfig": {
    "defaults": {
      "color": {
        "mode": "palette-classic"

     },
      "custom": {
        "axisLabel": "",
        "axisPlacement": "auto",
        "barAlignment": 0,
        "drawStyle": "line",
        "fillOpacity": 0,
        "gradientMode": "none",
        "hideFrom": {
          "legend": false,
          "tooltip": false,
          "viz": false

       },
        "lineInterpolation": "linear",
        "lineWidth": 1,
        "pointSize": 5,
        "scaleDistribution": {
          "type": "linear"

       },
        "showPoints": "auto",
        "spanNulls": true,
        "stacking": {

          "group": "A",
          "mode": "none"

       },
        "thresholdsStyle": {
          "mode": "off"

       }
     },
      "mappings": [],
      "thresholds": {
        "mode": "absolute",
        "steps": [
         {
            "color": "green",
            "value": null

         },
         {
            "color": "red",
            "value": 80

         }
       ]
     },
      "unit": "decbytes"

   },
    "overrides": []
 },
  "gridPos": {
    "h": 8,
    "w": 12,
    "x": 11,
    "y": 15

 },
  "id": 14,
  "options": {
    "legend": {
      "calcs": [],
      "displayMode": "list",
      "placement": "bottom"

   },
    "tooltip": {
      "mode": "single",
      "sort": "none"

   }
 },
  "targets": [
   {
      "alias": "",
      "bucketAggs": [
       {
          "field": "tag.keyword",

          "id": "2",
          "settings": {
            "min_doc_count": "1",
            "order": "desc",
            "orderBy": "_term",
            "size": "10"

         },
          "type": "terms"

       },
       {
          "field": "time",
          "id": "3",
          "settings": {
            "interval": "auto",
            "min_doc_count": "0",
            "timeZone": "utc",
            "trimEdges": "0"

         },
          "type": "date_histogram"

       }
     ],
      "datasource": {
        "type": "elasticsearch",
        "uid": "Nmnw4m7Vz"

     },
      "metrics": [
       {
          "field": "value",
          "id": "1",
          "type": "max"

       }
     ],
      "query": "endpoint:$instance AND
metric:\"system.disk.io.byte.write\"", "refId": "A", "timeField": "time"
   }
 ],
  "title": "磁盘IO输出",
  "type": "timeseries"
}, { "datasource": { "type": "elasticsearch", "uid": "Nmnw4m7Vz"
 },
  "fieldConfig": {
    "defaults": {
      "color": {

        "mode": "palette-classic"

     },
      "custom": {
        "axisLabel": "",
        "axisPlacement": "auto",
        "barAlignment": 0,
        "drawStyle": "line",
        "fillOpacity": 2,
        "gradientMode": "none",
        "hideFrom": {
          "legend": false,
          "tooltip": false,
          "viz": false

       },
        "lineInterpolation": "smooth",
        "lineStyle": {
          "fill": "solid"

       },
        "lineWidth": 2,
        "pointSize": 3,
        "scaleDistribution": {
          "type": "linear"

       },
        "showPoints": "always",
        "spanNulls": true,
        "stacking": {
          "group": "A",
          "mode": "none"

       },
        "thresholdsStyle": {
          "mode": "off"

       }
     },
      "mappings": [],
      "thresholds": {
        "mode": "absolute",
        "steps": [
         {
            "color": "green",
            "value": null

         }
       ]
     }
   },
    "overrides": []
 },
  "gridPos": {
    "h": 8,
    "w": 23,

    "x": 0,
    "y": 23

 },
  "id": 16,
  "options": {
    "legend": {
      "calcs": [],
      "displayMode": "list",
      "placement": "bottom"

   },
    "tooltip": {
      "mode": "single",
      "sort": "none"

   }
 },
  "targets": [
   {
      "alias": "网络每秒出流量",
      "bucketAggs": [
       {
          "field": "time",
          "id": "2",
          "settings": {
            "interval": "auto",
            "min_doc_count": "0",
            "timeZone": "utc",
            "trimEdges": "0"

         },
          "type": "date_histogram"

       }
     ],
      "datasource": {
        "type": "elasticsearch",
        "uid": "Nmnw4m7Vz"

     },
      "metrics": [
       {
          "field": "value",
          "id": "1",
          "type": "avg"

       }
     ],
      "query": "endpoint:$instance AND
metric:\"system.net.if.byte.sent.sec\"", "refId": "A", "timeField": "time"
   },
   {
      "alias": "网络每秒进流量",
      "bucketAggs": [
       {
          "field": "time",
          "id": "2",
          "settings": {
            "interval": "auto",
            "min_doc_count": "0",
            "timeZone": "utc",
            "trimEdges": "0"

         },
          "type": "date_histogram"

       }
     ],
      "datasource": {
        "type": "elasticsearch",
        "uid": "Nmnw4m7Vz"

     },
      "hide": false,
      "metrics": [
       {
          "field": "value",
          "id": "1",
          "type": "avg"

       }
     ],
      "query": "endpoint:$instance AND
metric:\"system.net.if.byte.recv.sec\"", "refId": "B", "timeField": "time"
   }
 ],
  "title": "网络每秒流量",
  "type": "timeseries"
} ], "refresh": "", "schemaVersion": 35, "style": "dark", "tags": [], "templating": { "list": [ { "current": { "selected": true, "text": "621f2f2e3682498c6cf4c6bf_server", "value": "621f2f2e3682498c6cf4c6bf_server"
   },
    "datasource": {
      "type": "elasticsearch",

    "uid": "Nmnw4m7Vz"

   },
    "definition": "
{\"find\":\"terms\",\"field\":\"endpoint.keyword\"}", "hide": 0, "includeAll": false, "label": "实例", "multi": false, "name": "instance", "options": [], "query": " {\"find\":\"terms\",\"field\":\"endpoint.keyword\"}", "refresh": 1, "regex": "", "skipUrlSync": false, "sort": 0, "type": "query"
}
] }, "time": { "from": "now-6h", "to": "now"
}, "timepicker": {}, "timezone": "", "title": "SmartOps数据源监控大屏", "uid": "u2tLHi7Vz", "version": 16, "weekStart": ""
}